
|
Astronomy 162:
Introduction to Stars, Galaxies, & the Universe
Prof. Richard Pogge, MTWThF 9:30
|
Lecture 21: Testing Stellar Evolution
Readings: Ch 21, section 21-3
- H-R Diagrams of Star Clusters
- Ages from the Main-Sequence Turn-off
- Open Clusters
- Young clusters of few 1000 stars
- Blue Main-Sequence stars & few giants
- Globular Clusters
- Old clusters of a few 100,000 stars
- No blue Main-Sequence stars & many giants
Testing Stellar Evolution
The Problem:
- Stellar Evolution happens on billion-year time scales.
- Astronomers only live for a few 10s of years.
The Solution:
- Make H-R Diagrams of star clusters with a wide range of ages.
Star Clusters
Groups of 100's to 1000's of stars moving together through space.
All stars in a cluster
- are at the same distance, so it is easy to measure
their relative Luminosities,
- have the same age,
- have the same chemical composition,
- have a wide range of stellar masses.
Each cluster thus provides a snapshot of what stars of different
masses look like at the same age (and composition)!
The Main Sequence, Revisited
The properties of stars along the Main Sequence give us clues as to
how to "read" a cluster H-R diagram.
As we have seen in previous lectures on
the Main Sequence and
Star Formation:
- The Main Sequence is a Mass Sequence:
- Massive stars are hot and high luminosity.
- Low-mass stars are cool and low luminosity.
- A star's Main-Sequence Lifetime depends on Mass:
- Massive stars have short M-S lifetimes
- Low-mass stars have long M-S lifetimes.
- Low-Mass stars take longer to form than High-Mass stars.
Progressive Evolution
As a cluster ages:
- Start with high-mass stars on the M-S, and low-mass stars
still approaching.
- High mass run out of hydrogen in their cores first, evolving
off into supergiants.
- As successively lower mass stars run out of hydrogen in their
cores, they too evolve off.
Effect is that stars peel off the Main Sequence from the top (high-mass end)
down as the cluster ages.
H-R Diagrams of a Model Star Cluster
Main Sequence Turn-off
Point where the Main Sequence "turns off" towards giant
stars.
- As cluster ages, the stars at the turn-off are lower mass
- Low mass stars have redder colors.
Color of the turn-off is an indicator of the cluster age:
- Older Clusters have redder and fainter turn-offs.
Types of Clusters
Open Clusters:
- Sparse clusters (few 100s - 1000s of stars)
- few parsecs in diameter
- Many blue Main-Sequence stars
- A few Giants
- Relatively Young ages (100's of Myr)
- Image of the young Open Cluster NGC 2266
(300k jpeg)
- Credit: Sven Kohle & Till Credner, image from Calar Alto.
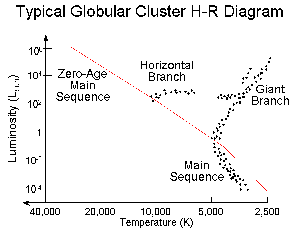
Globular Clusters:
- Rich spherical clusters (105-106 stars)
- 10-30 parsecs in diameter
- No blue Main-Sequence stars
- Many Giants
- Old Ages (few Gyr)
- Image of the Globular Cluster M80
(422K jpeg)
- Credit: Space Telescope Science
Institute
Open Clusters
H-R Diagrams of Open Clusters show:
- They are young to middle-aged
- Have blue Main-Sequence stars
- Few supergiants or giants
- Old Open clusters have more red giant stars
- Don't see Horizontal Branch stars
- Youngest Open Clusters still have gas clouds associated with them
[H-R Diagrams for 2 open clusters (The Pleiades &
Praesepe) with different ages (7Kb GIF)]
Globular Clusters
H-R Diagrams of Globular Clusters show:
- Very old ages: 10-13 Billion Years
- Red turnoffs and no blue Main-Sequence stars
- Many Red Giants but no Supergiants
- A prominent Horizontal Branch
- Slightly bluer and fainter Main Sequence due
to having less metals than nearby stars

Conclusions
Cluster H-R Diagrams give us a snapshot of stellar evolution.
Observations of clusters with ages from a few Million to 15 Billion
years confirms much of our picture of stellar evolution.
Piecing together the story of Stellar Evolution has been a triumph of
observational and theoretical work. We still have many questions to
answer, but the big picture is secure.
Return to [
Unit 3 Index
|
Astronomy 162 Main Page
]
Updated: 2006 January 29
Copyright © Richard W. Pogge, All Rights Reserved.

